Check out this interactive map from the Quest Diagnostics annual Drug Test Index to find out the states with the highest drug use.
Drug Testing Index™: Overall Positivity Rate
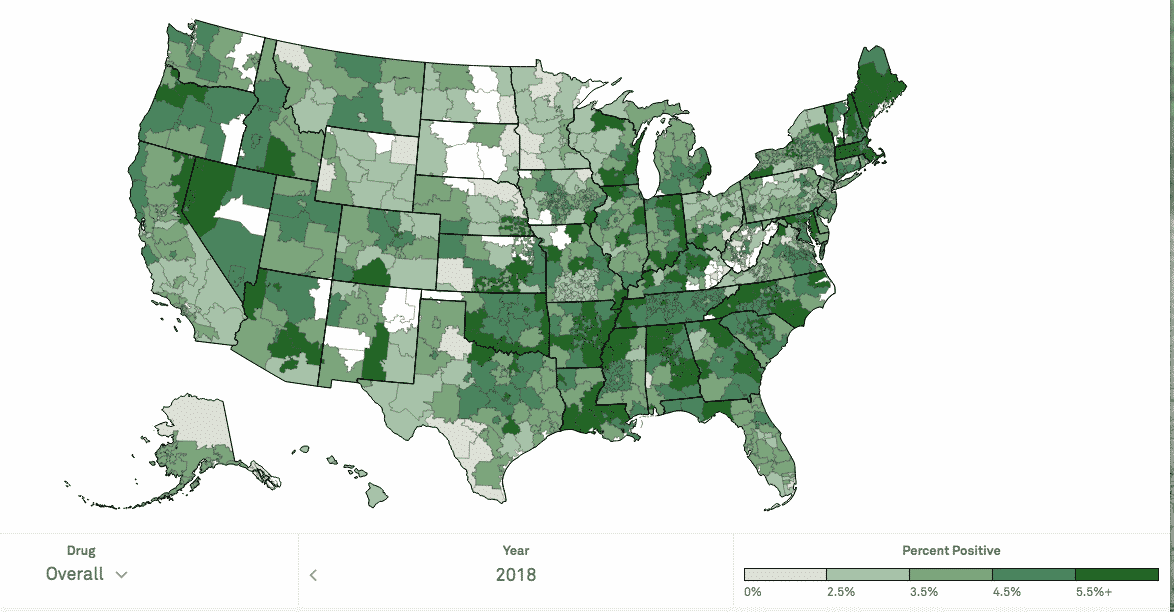
This interactive map shows urine drug test positivity by 3-digit zip code in the United States. The Quest Diagnostics Drug Testing Index™ is a comprehensive analysis of workforce drug use trends. This map is an analysis of the combined U.S. workforce.
Analysis of ten million workplace drug test results from Quest Diagnostics shows increases in marijuana positivity across nearly all employee testing categories. Not really surprising, considering the trend toward state laws legalizing marijuana.
Notably, increases in post-accident positives in the general U.S. workforce outpace those for all other testing reasons, including pre-employment screening. It certainly makes sense that if there is more drug use, that there are more workplace accidents attributed to more drug use.
2018 marked a fourteen-year high (so to speak), according to Quest Diagnostics, a leading provider of diagnostic testing services.
Positivity rates in the combined U.S. workforce increased nearly five percent in urine drug tests. This rise brought the rates to the highest level since 2004 (4.5%). They are now more than 25 percent higher than the thirty-year low of 3.5 percent recorded between 2010 and 2012.
“Combined U.S. workforce” means both DOT-regulated and non-regulated employees. Positivity for regulated employees is around 1% and non-regulated, general workforce positivity rate is much higher. Read more here.